NavGator
Architecture connection tracker that maps your stack before you change it.
Install
claude plugin marketplace add tyroneross/RossLabs-AI-Toolkit
claude plugin install navgator@rosslabs-ai-toolkit
The Problem
AI coding assistants make changes without full context of how components connect. You ask for a database schema change and the migration file gets updated, while the 12 API routes that query the table, the 3 background jobs that write to it, and the dashboard that aggregates it do not. Modern apps are connection graphs, not isolated modules. Without a map, you are navigating architecture blindfolded.
What I Built
NavGator scans a codebase, builds a typed connection graph, and answers “what breaks if I change this?” before you change it. It also annotates each component with the runtime identity it ships under (service name, queue, endpoint, deploy target) so a runtime failure can be traced back to the code that produced it.
Architecture
NavGator is a static-analysis pipeline, not an AI system. It never calls a model to understand a codebase — every component, connection, and score comes from file reads, glob walks, AST parsing, and graph algorithms. It does track LLM usage inside the scanned target repo (which files call OpenAI, Anthropic, Groq, etc.), but that is pattern-matching against known SDK imports and call shapes, not an LLM asking an LLM.
flowchart LR
A["CLI / MCP call<br/>navgator scan"] --> B["Phase 1: Bootstrap<br/>package.json, lockfiles,<br/>requirements.txt (<1s)"]
B --> C["Phase 2: Deep scan<br/>glob walk + pattern match"]
C --> D["ts-morph AST<br/>(TS/JS, optional)"]
C --> E["Swift / Rust /<br/>SCIP source scanners"]
D --> F["Typed component +<br/>connection records"]
E --> F
F --> G["Runtime topology enrichment<br/>(env vars, deploy configs)"]
G --> H["LLM use-case dedup<br/>(pattern-based, no model call)"]
H --> I["Graphology metrics<br/>PageRank + Louvain (fixed seed)"]
I --> J[("File-based JSON/JSONL store<br/>.navgator/architecture/*")]
J --> K["CLI + 10 MCP tools +<br/>13 slash commands"]
J --> L["Next.js web dashboard"]
M["PostToolUse hook<br/>dirty-set ledger"] -.background drainer.-> CEnd-to-end data flow:
- Entry. A scan starts from the CLI (
navgator scan), an MCP tool call from Claude Code or Codex, or thePostToolUsefreshness hook after an agent edits a file. - Phase 1 — Bootstrap (< 1s). Reads
package.json, lockfiles,requirements.txt,Package.swift,Cargo.tomlto detect the stack: frameworks, databases, queues, providers. - Phase 2 — Deep scan (5–30s).
globwalks the source tree against a default ignore list plus an optional.navgatorignore, then pattern-matches service calls, DB operations, imports, and AI prompts. - AST / source-language scanners (optional, additive).
ts-morphparses TypeScript/JavaScript for dynamic imports and reflection-based calls that pattern matching misses; dedicated Swift and Rust scanners extract types, protocol conformance, anduse/import graphs directly from source;@sourcegraph/scip-typescriptsupplies an optional cross-reference index layer. - Incremental diffing. SHA-256 hashes of every scanned file are compared against the prior
hashes.json; only changed files re-analyze, and connections for deleted files are dropped automatically. - Parallel merge. Four worker threads (default) partition the file set, build partial graphs, and merge — the mechanism that keeps 10,000+ file repos scanning without memory pressure.
- Runtime topology enrichment. Service names, endpoint URLs, queue names, and deploy targets are extracted from Dockerfiles,
vercel.json/railway.json, and env vars, then annotated onto the matching graph nodes — no polling, no live health checks. - LLM use-case dedup. A 3-layer pipeline (filter test/dev/import-only sites → group by prompt-match, function name, or call-type+model → merge groups connected via the import graph) collapses raw call sites (e.g. 154) into distinct use cases (e.g. 8). Entirely heuristic; no model is called to do the grouping.
- Graph metrics.
graphologybuilds aDirectedGraph;graphology-metricscomputes PageRank centrality andgraphology-communities-louvaincomputes community clusters, both under a fixed Mulberry32 seed for reproducible output (suppressed below 20 nodes, where the algorithms degenerate). Scores back-annotate each component and drive thehotspot-modulerule. - Storage. Everything lands as JSON/JSONL under
<project>/.navgator/architecture/—components.full.jsonlandconnections.full.jsonlare canonical;graph.json,index.json,file_map.json,reverse-deps.json, andNAVSUMMARY.mdare derived views. There is no database — the file store is the datastore. - Freshness loop. A non-blocking
PostToolUsehook appends to a dirty-file ledger as an agent edits; a background drainer coalesces entries, holds a single-writer scan lock, and rescans only the changed surface; every read consults a freshness stamp with an in-process debounce to avoid scan storms. - Consumption. The CLI, 10 MCP tools, 13 Claude Code slash commands, 4 subagents, 6 skills, Codex’s skill/MCP surface, and the Next.js web dashboard all read the same JSON store to answer
impact,trace,diagram,dead,schema, andrulesqueries.
Models. None. NavGator’s own execution path never calls an LLM, local or hosted — component detection, connection classification, LLM-use-case grouping, and hotspot scoring are all deterministic pattern matching and graph algorithms. This is a deliberate choice, not an omission: determinism means the tool works on broken/unbuildable code, runs safely in CI, and produces identical output on identical input (the graph algorithms are seeded for exactly this reason). The “LLM” it talks about in its own output is always the target repo’s usage, detected by matching known provider SDK names and call shapes.
Tools & infra.
- Commander — CLI argument parsing and command routing for the
navgatorbinary. - glob — file discovery across the scanned repo, respecting ignore patterns; chosen because both scan phases are pure file reads with no build step.
- ts-morph — optional TypeScript/JavaScript AST parsing, used only when accuracy on dynamic imports/reflection is worth ~3x the scan time.
- @sourcegraph/scip-typescript — optional SCIP index generation for deeper cross-reference resolution.
- graphology + graphology-metrics + graphology-communities-louvain — directed graph, PageRank centrality, and Louvain community detection over the connection graph; powers hotspot and dead-component rules.
- File-based JSON/JSONL store —
.navgator/architecture/*, chosen over a database because the tool ships as a zero-install npm package/CLI plugin with no server to provision; aMap<string, Set<string>>adjacency list keeps a 1,000-file/5,000-connection graph under ~2MB. - Next.js (v16, bundled standalone into the npm package) — the
navgator uiweb dashboard for browsing components, connections, and diagrams visually. - MCP server (
dist/mcp/server.js) — exposes 10 read-only tools so Claude Code and Codex query the graph without shelling out to the CLI.
Impact Analysis Leads
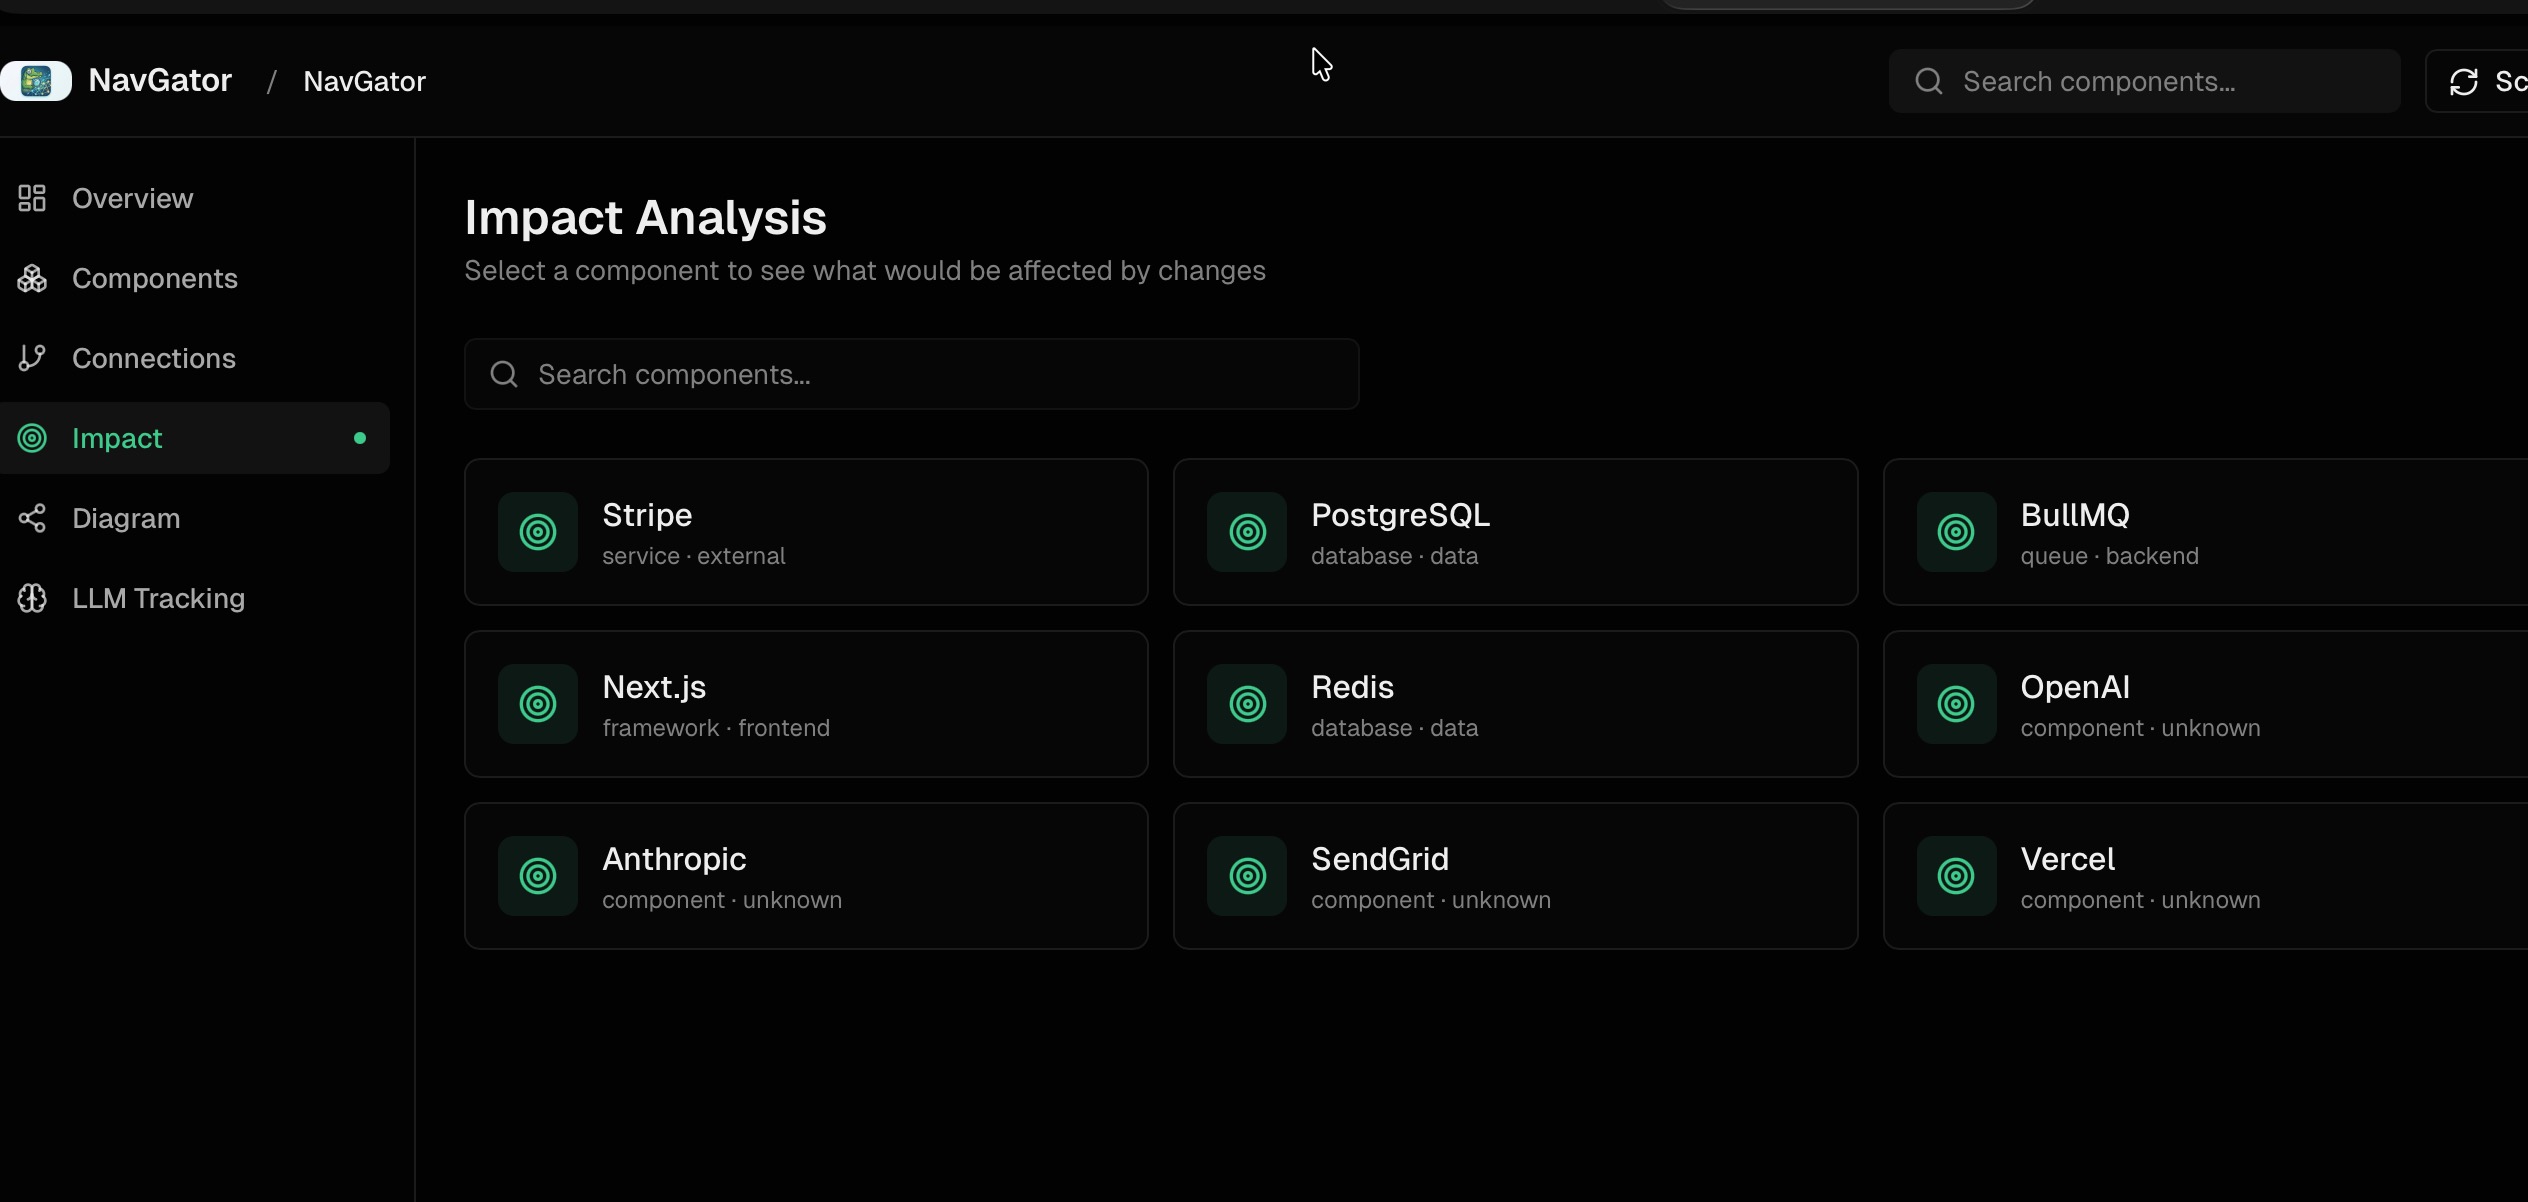
The core command is navgator impact "<thing>". It returns every file that imports, calls, references, or types against the named component, with file:line so each connection is verifiable. Migrating from Stripe SDK v11 to v12 might surface 47 affected files split across API routes, components, webhook handlers, utilities, jobs, and a CLI script. Pre-change, that is a checklist. Post-change, the same query verifies nothing was missed.
How Scanning Works
Two phases keep the tradeoff honest:
| Phase | Source | Time | What it finds |
|---|---|---|---|
| 1 — Bootstrap | package.json, lockfiles, requirements.txt | < 1s | Stack: frameworks, databases, queues, providers |
| 2 — Deep | Static analysis + AST (optional ts-morph) | 5–30s | Service calls, DB ops, prompts, typed signatures |
Both phases are pure file reads, no execution. NavGator scans broken codebases that won’t build. SHA-256 hashing makes subsequent scans incremental — only changed files re-analyze, and deletions remove their connections automatically.
Freshness Pipeline
A graph that goes stale silently is worse than no graph. The freshness layer keeps the answer honest without forcing a manual re-scan loop:
- Dirty-set ledger — append-only, atomic writes. A non-blocking
PostToolUsehook marks files dirty as the coding agent edits them. - Background drainer — coalesces dirty entries, holds a single-writer scan lock with stale/dead detection, scans only the changed surface, and stamps the result.
- Honesty contract — every read consults the stamp. An in-process debounce on
autoRefreshIfStaleprevents scan storms when ten queries land in the same second.
The result: when you ask navgator impact "X", the answer reflects the repo as it stands, not as it stood the last time someone remembered to run scan.
Runtime Topology — Code to Production Identity
A static dependency graph tells you which file calls which function. It does not tell you that the function runs inside the email-queue BullMQ worker on Railway, behind the notifications.api service URL. When that worker backs up at 2am, you bridge two worlds by hand.
NavGator’s runtime topology layer closes that gap by extracting runtime identity from code and config — service names from deploy manifests, endpoint URLs from env vars, queue names from BullMQ definitions, container targets from Dockerfiles — and annotating the existing graph nodes with them. A failure ticket that says “Railway worker email-queue is failing” maps back to producer code, consumer code, env-var dependencies, and deploy target in one query.
This is not live monitoring. NavGator does not poll services, hit health endpoints, or query metrics APIs. That is observability tooling territory (Datadog, Grafana, Railway logs). NavGator stays static — it just makes the static map speak the same language as the runtime.
LLM Use-Case Deduplication
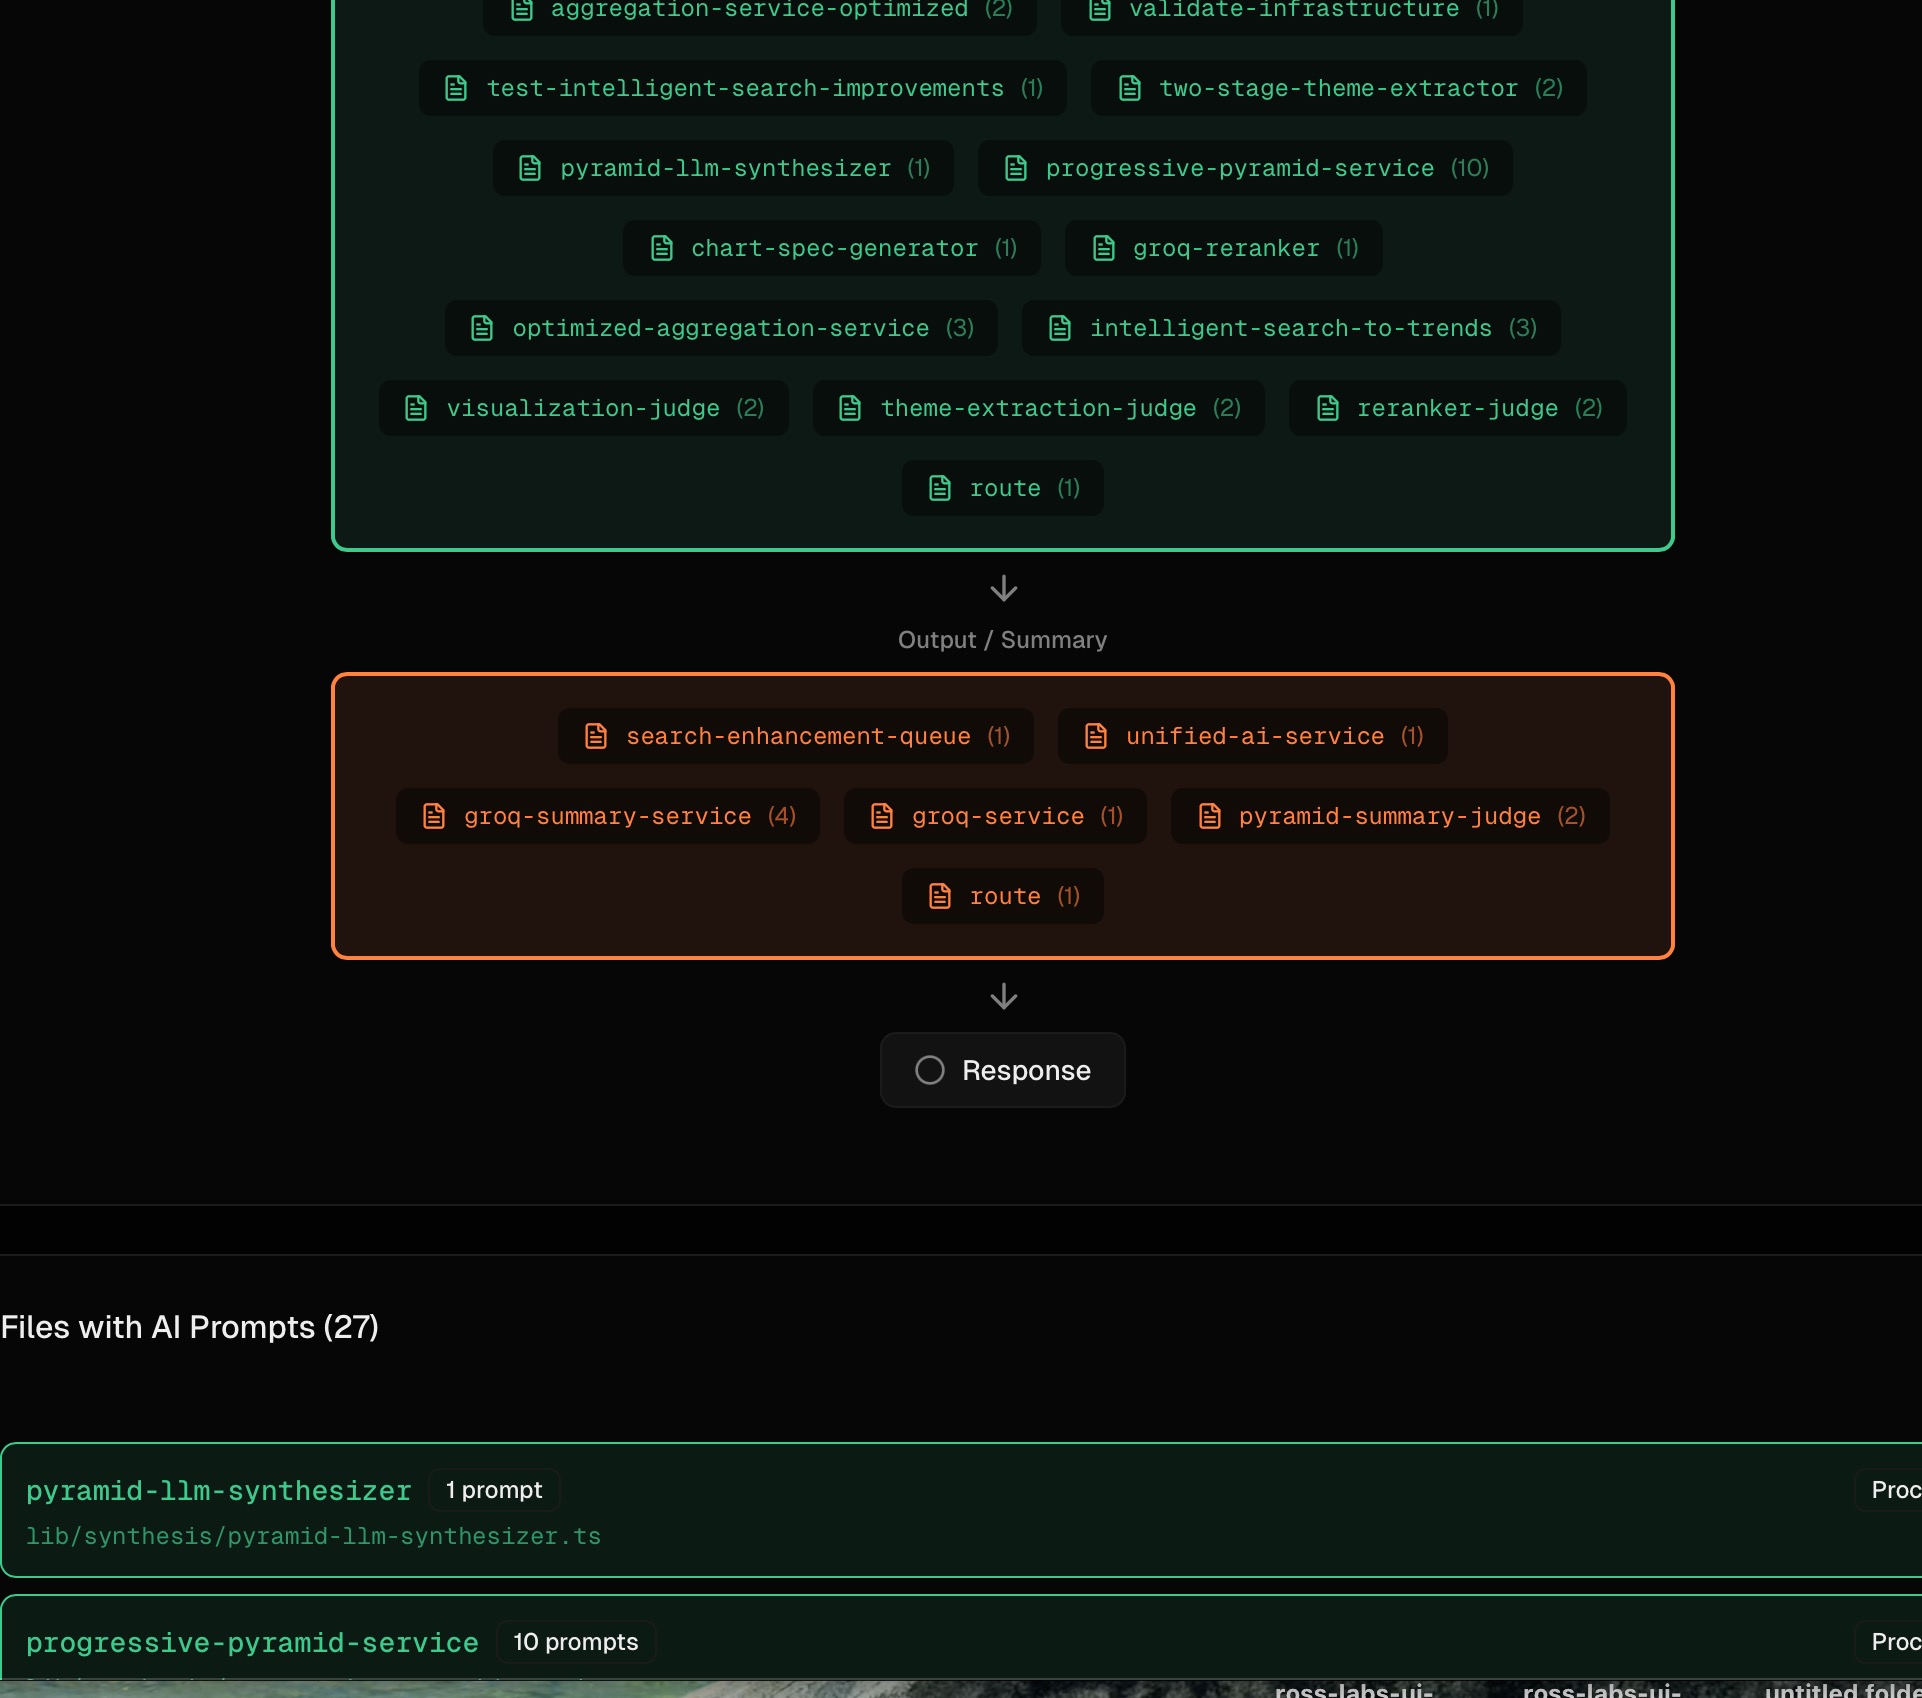
Counting raw import and new OpenAI() sites is the wrong number. One real project showed 154 “LLM connections” — but only 8 distinct use cases (article summarization, entity extraction, embeddings, search routing, classification, and a few more). The other 146 were the same use case re-imported across script files, test files, and standalone runners. Some were imported but never called.
NavGator groups LLM call sites by purpose, not by file, and filters by the existing production-vs-test classification before counting. The headline becomes “8 LLM use cases across 3 providers” instead of “154 service calls.” That is the right granularity for the actual question — what LLM use cases do I need to govern, monitor, or consolidate — because you tune use cases, not call sites.
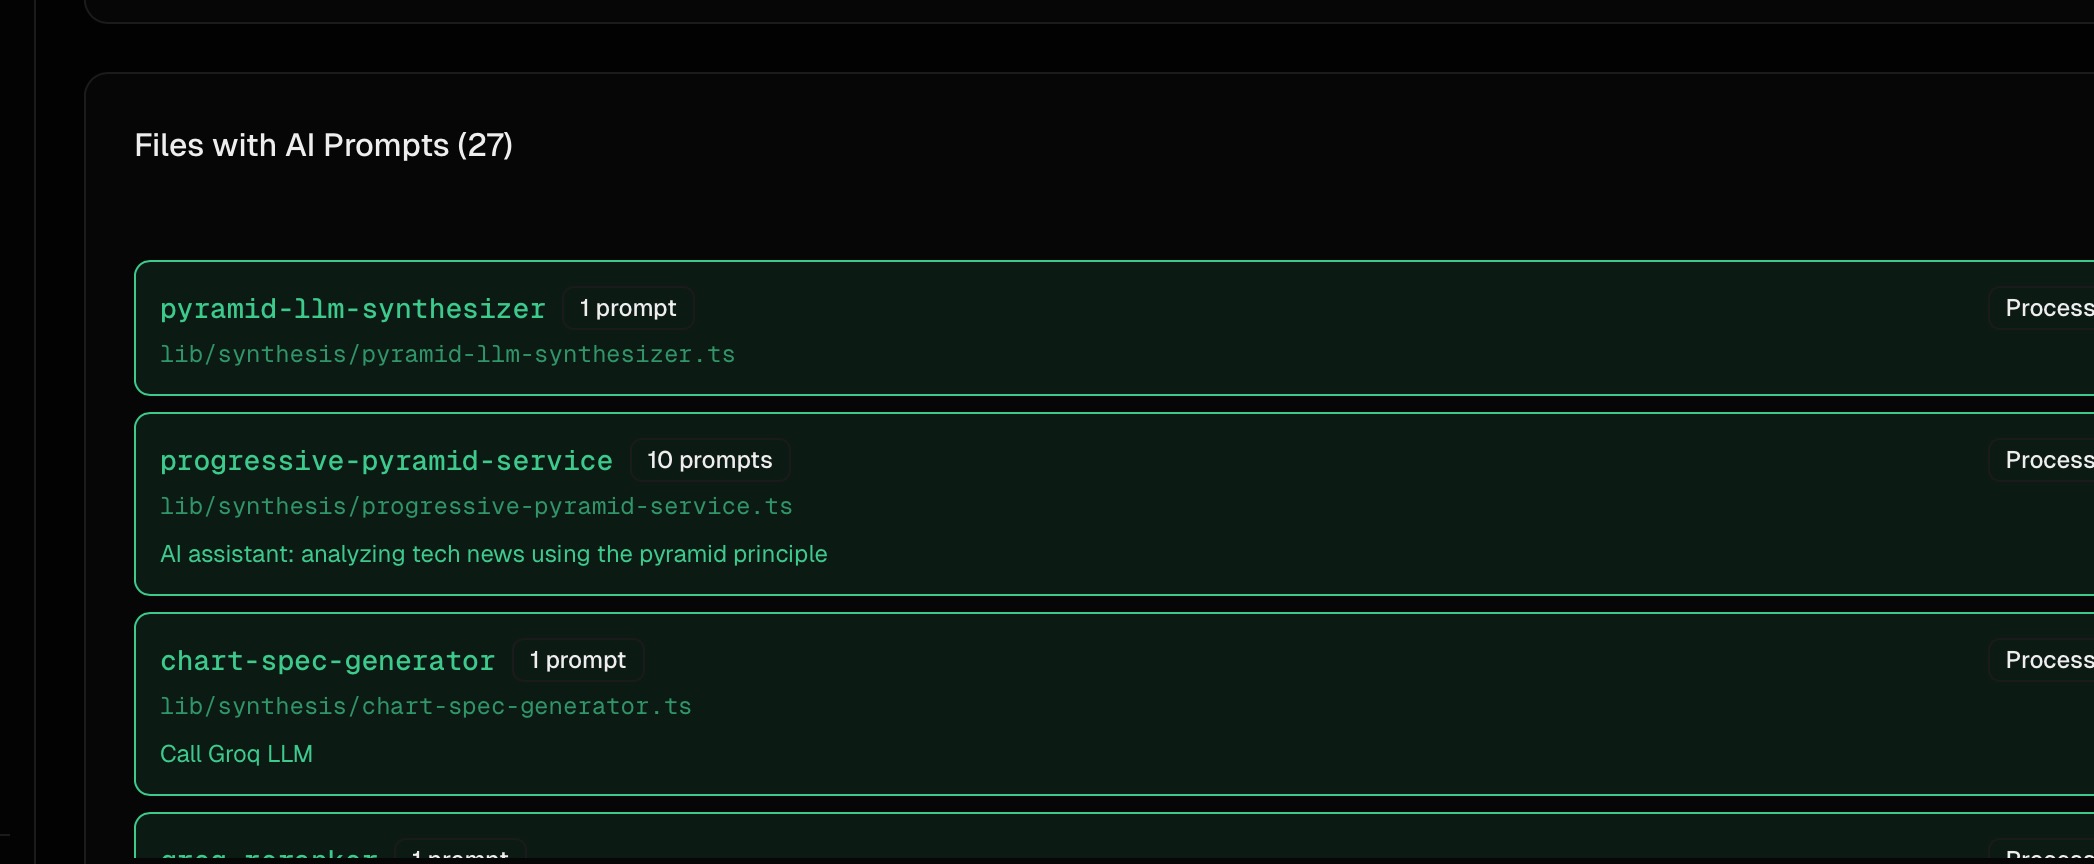
The prompt detector pulls prompt content, variable bindings, and call type (chat, summarization, extraction, classification, generation), which is what makes purpose-level clustering possible. A file with 10 prompts attached jumps out as a consolidation candidate.
Tiered Memory
NavGator writes its analysis into a layered store so AI assistants load only what they need:
| Layer | File | Loaded |
|---|---|---|
| Hot context | SUMMARY.md (40–150 lines) | First, every session |
| Structured | index.json, graph.json, file_map.json | On programmatic queries |
| Detailed | components/, connections/ per-file | On demand only |
SUMMARY.md carries timestamps and invalidates when package.json is newer, so Phase 1 re-runs without manual intervention. file_map.json keys on relative paths so a directory rename does not nuke hours of analysis.
Host Surfaces
Claude Code gets /navgator:* slash commands: map, plan, scan, trace, impact, test, review, llm-map, schema, dead, lessons. The architecture-planner agent picks up /navgator:plan "<intent>", checks graph freshness, runs an incremental scan if stale, then dispatches read-only NavGator tools and aggregates findings.
Codex has its own additive plugin surface — skills and MCP tools — with native marketplace metadata at .codex-plugin/plugin.json and .agents/plugins/marketplace.json. Claude remains the authoritative host for hooks, slash commands, and agent wiring.
Visualization
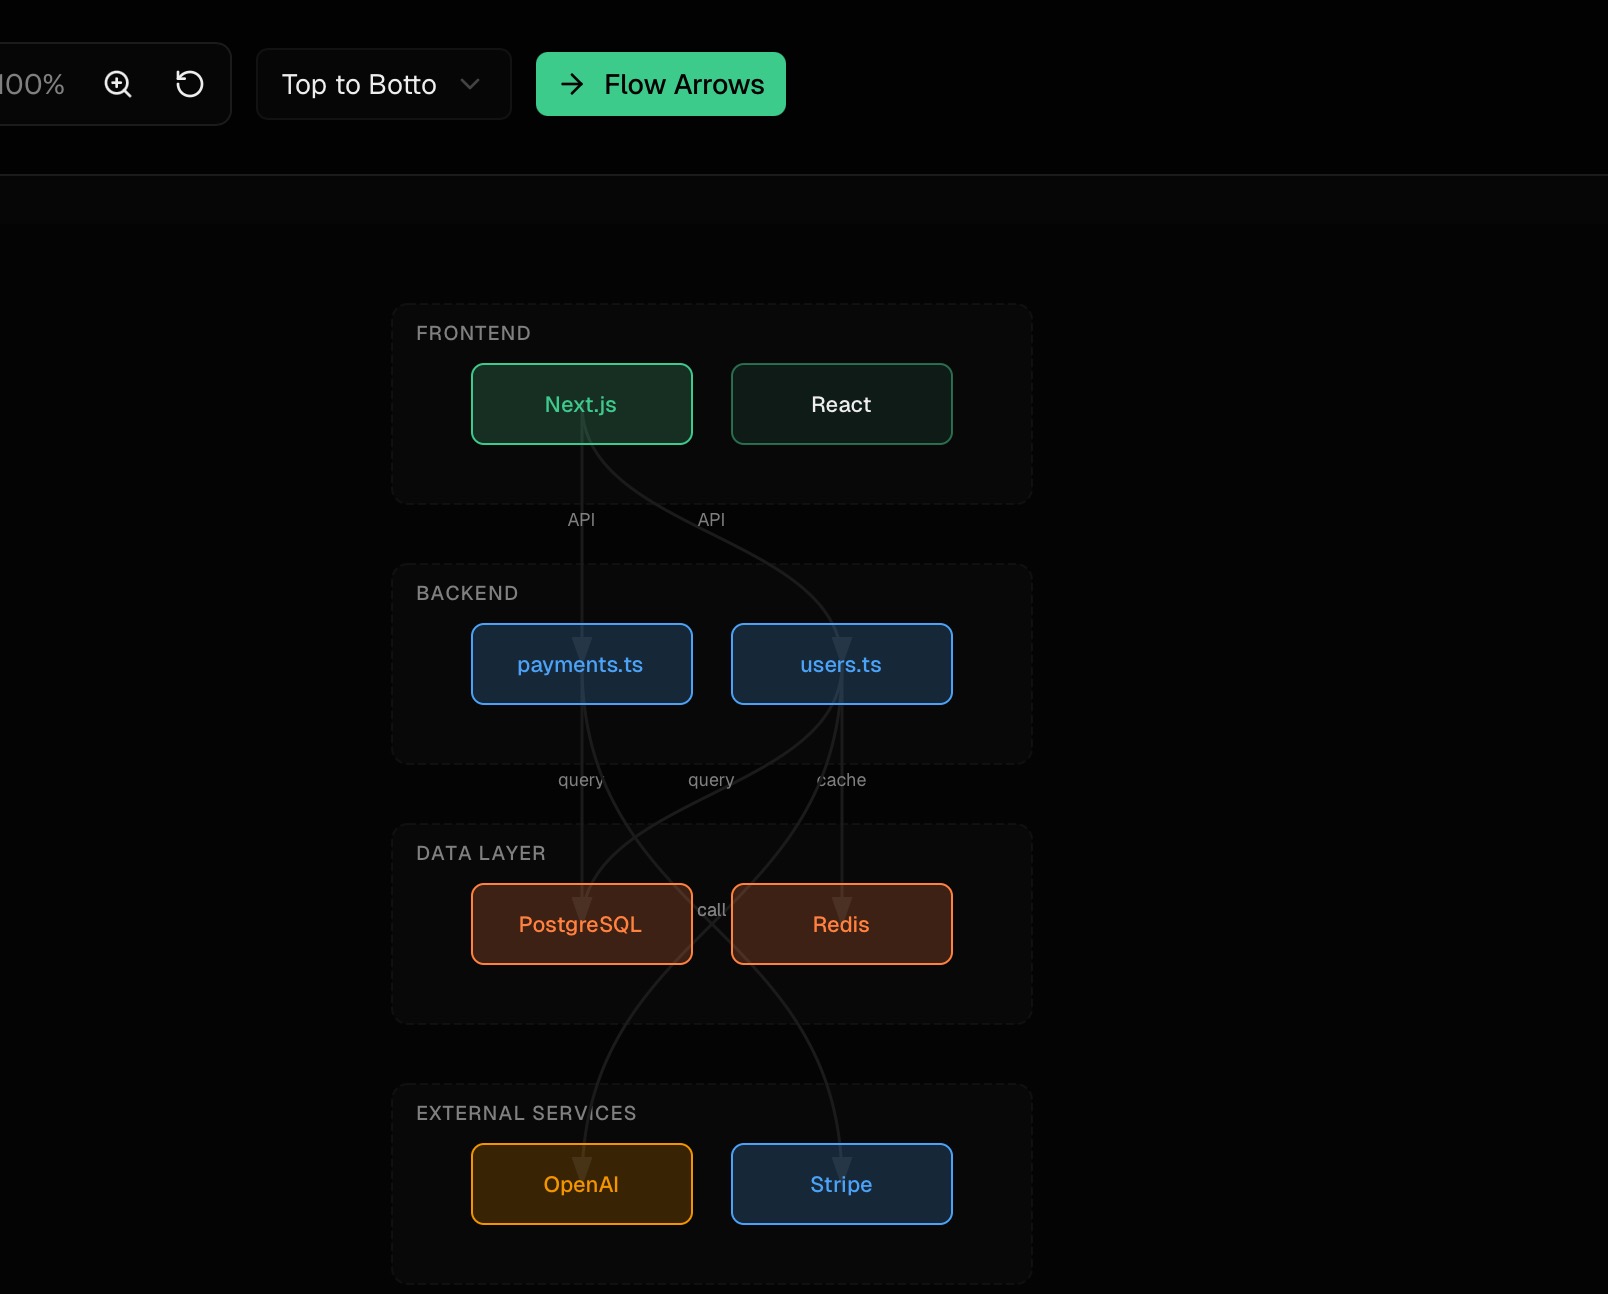
Diagrams group components by layer with color-coded categories, showing API → Database → Cache flows with labeled connection types. File-level diagrams show import relationships. Output is Mermaid, JSON, or CSV.
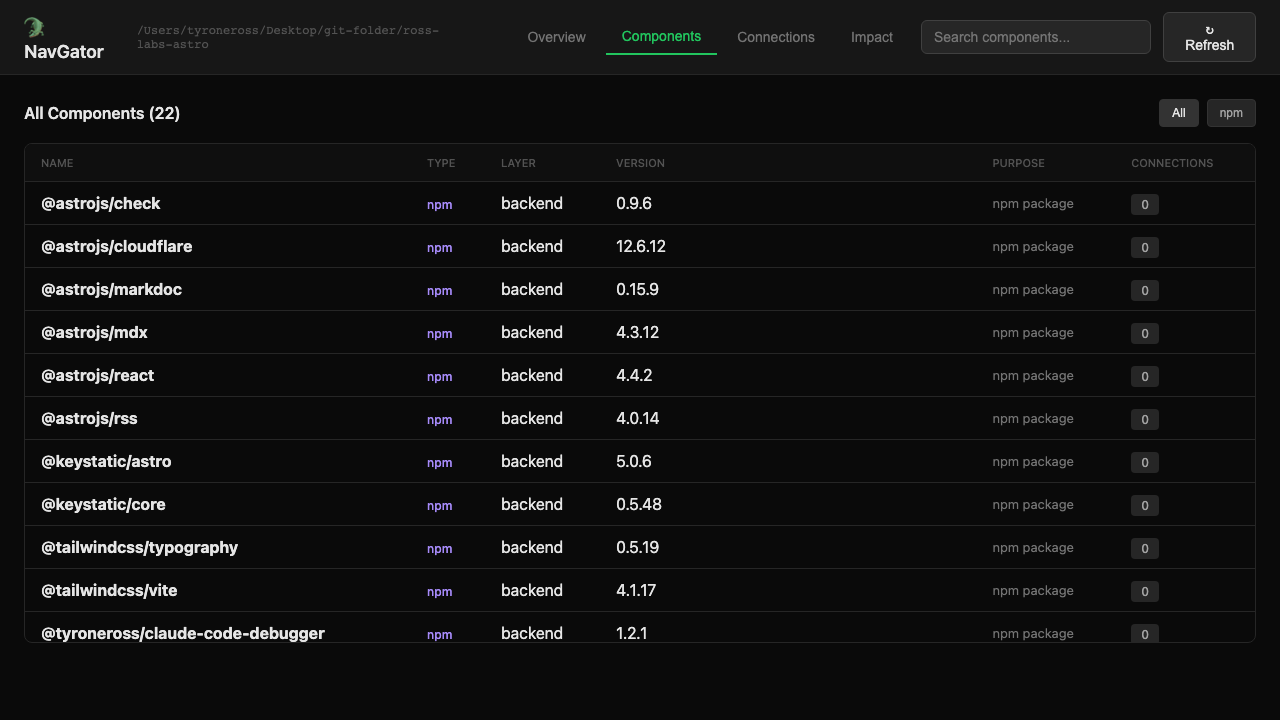
Tech stack
TypeScript, Commander (CLI), glob (file discovery), ts-morph (optional TS/JS AST), @sourcegraph/scip-typescript (optional cross-reference index), Graphology + graphology-metrics + graphology-communities-louvain (PageRank/Louvain graph metrics), file-based JSON/JSONL storage (no database), Next.js (web dashboard), MCP server (10 tools). No LLM in the execution path.
Results
Figures below are drawn from the write-ups and screenshots elsewhere on this page; rows marked illustrative are worked examples of the tool’s output shape, not measured runs.
| Metric | Figure | Source |
|---|---|---|
| LLM call-site deduplication | 154 raw sites → 8 use cases (roughly 95% reduction) | One project’s import/new OpenAI() count collapsed to 8 distinct use cases across 3 providers after purpose-level grouping |
| Blast-radius query (illustrative) | e.g. ~47 files for a Stripe SDK v11→v12 migration | Illustrative navgator impact walkthrough — an example of the scope a query spans (API routes, components, webhook handlers, utilities, jobs, a CLI script), not a measured run |
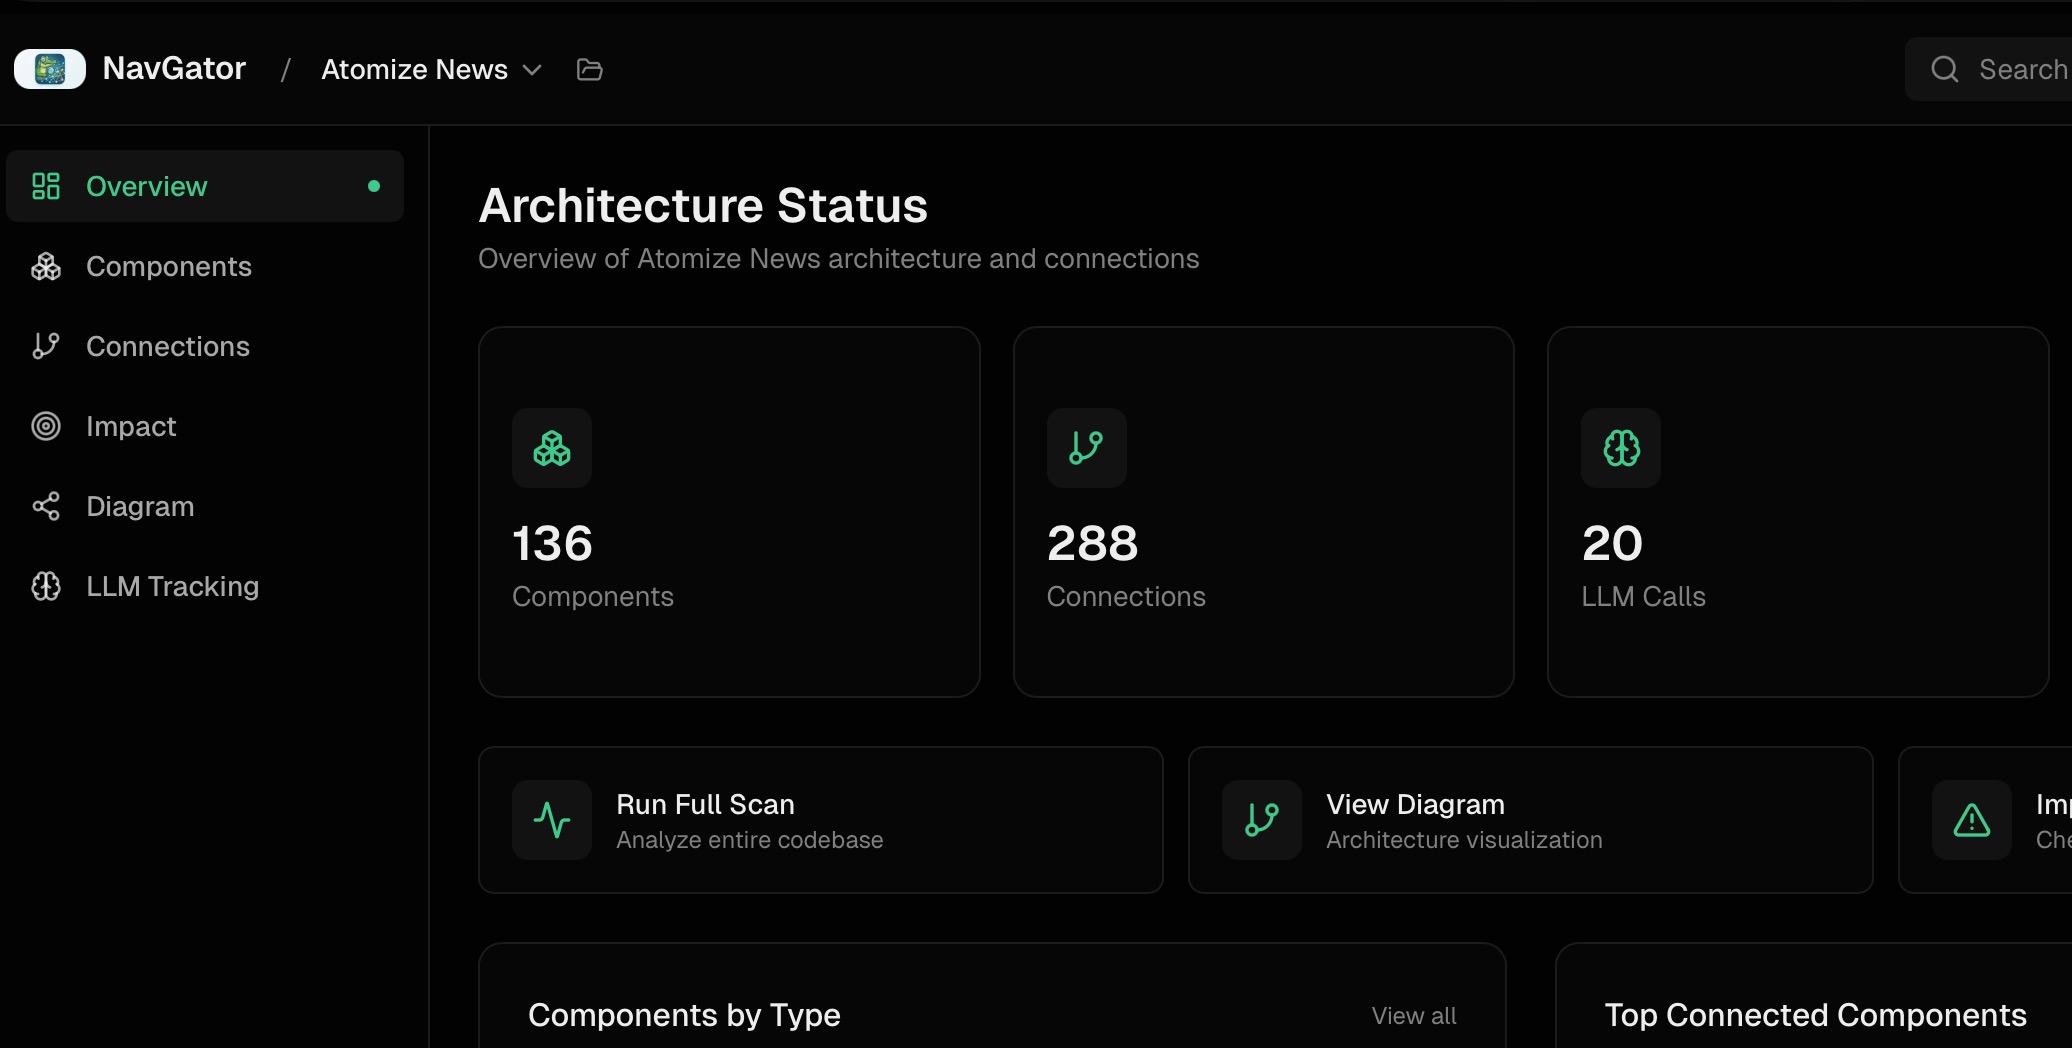
| Reference-project scan | 136 components, 288 connections, 20 LLM calls tracked | Architecture Status dashboard snapshot |
| Bootstrap scan (Phase 1) | < 1s | package.json/lockfile parsing |
| Deep scan (Phase 2) | 5–30s | Static analysis + optional ts-morph AST |
| ts-morph AST mode | ~50% accuracy gain at ~3x scan time | Tradeoff vs. pattern-matching alone |
| Graph memory footprint | under ~2MB | Adjacency-list (Map<string, Set<string>>) for a 1,000-file / 5,000-connection project |
| Parallel scaling | 10,000+ files | Default 4 worker threads, partition-and-merge, no reported memory pressure |
⚠️ no benchmark yet for end-to-end time saved per incident or adoption across teams — the figures above cover scan mechanics, graph size, and one worked migration example, not a controlled before/after study.
Technical Decisions
No execution, ever. Both scan phases are static analysis. Runtime crashes in the target app do not break NavGator. This is also what lets it run in CI on PR branches that haven’t been built.
Optional ts-morph for TypeScript. AST scanning catches dynamic imports, computed property access, and reflection-based calls that pattern matching misses. Roughly 50% accuracy gain at ~3x the scan time. Heavy-metaprogramming projects benefit most; thin projects do not need it.
Adjacency-list graph. A Map<string, Set<string>> representation keeps a 1,000-file / 5,000-connection project under ~2MB. A dense matrix would burn 1M cells on a sparse graph.
Parallel workers. Default 4 worker threads partition the file set, build partial graphs, and merge. Scales to 10,000+ files without memory pressure.
Boundaries. NavGator annotates the graph with runtime identity extracted from code and config. It does not poll, scrape, or hit live infra. That keeps the tool deterministic, offline-capable, and safe to run anywhere.